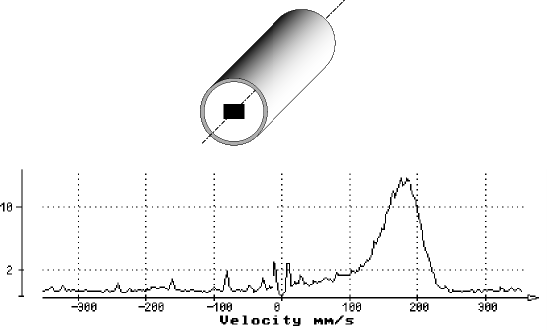
The DOP can compute the power spectrum of a data series by means of an FFT
algorithm. The data series is formed by samples taken on the demodulated I and
Q signals for a selected depth which corresponds to one gate.
Before the computation of the power spectrum, the data series is filtered
by a high pass filter which removes all the stationary components contained
in the demodulated signals. In order to make the reading of the frequency
scale more easy, the frequency scale is converted in velocity by using the
standard Doppler formula. The ordinate gives the relative amplitude, in
a logarithmic scale, of the power spectrum.
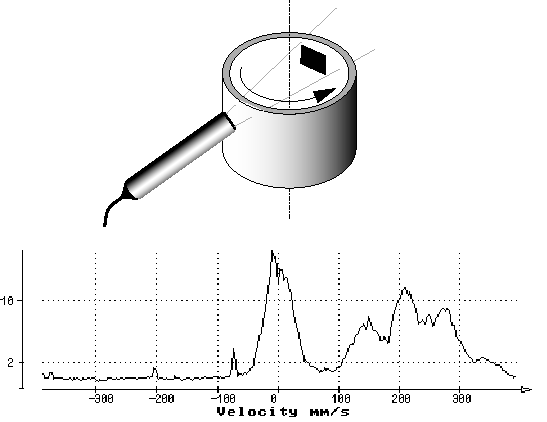
The computation of power spectrum is the best way to analyze the frequency
content of the signal issue from a gate. When once looks at the velocity
profile, all the gates give a single value of velocity. These values are
the result of a computation of the mean Doppler frequency, which is the
real mean value (non biased) of the power spectrum. This means that
no information is given about the distribution of the Doppler energy.
The same value of velocity can result from many different frequency distributions.
The display of the complete power spectrum is a good method to increase the
knowledge on the measured velocity values.