Technique – Application notes

Using the power spectrum (FFT) of Doppler echoes

Why using the power spectrum of one gate

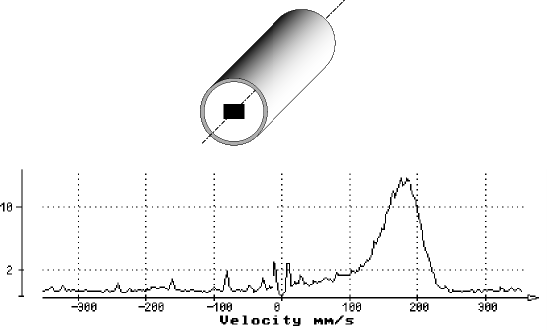
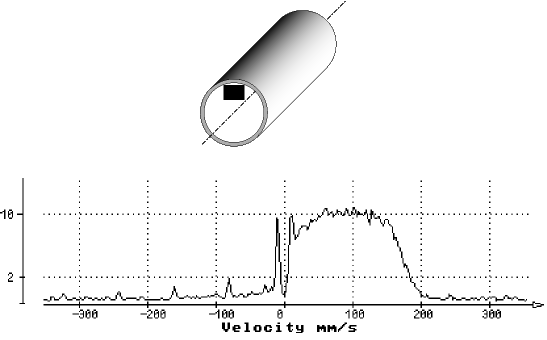
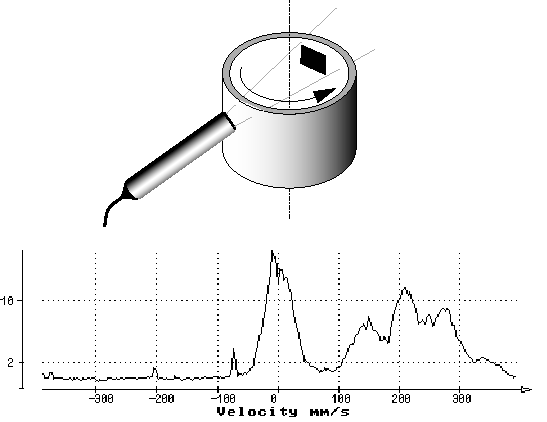
The DOP can compute the power spectrum of a data series using an FFT algorithm. The data series is formed by samples taken from the demodulated I and Q signals for a selected depth corresponding to one gate.

Before computing the power spectrum, the data series is filtered by a high-pass filter that removes all stationary components. To facilitate reading, the frequency scale is converted into velocity using the standard Doppler formula. The ordinate shows the relative amplitude of the power spectrum in logarithmic scale.

Computing the power spectrum is the best way to analyze the frequency content of a single gate. Velocity profiles computed from the gates only provide the mean Doppler frequency, which is unbiased but does not give information about the Doppler energy distribution. The same mean velocity can result from many different frequency distributions. Displaying the full power spectrum increases understanding of the measured velocities.

Power spectrum of Doppler echoes at center of tube
Example: Power spectrum of a gate in the middle of a tube.

How to use the power spectrum

Different situations illustrate how the power spectrum provides insights into measured velocities. In the first example, the gate is placed in the middle of a tube with liquid flow. The power spectrum shows that the sampling volume contains multiple Doppler frequencies. The width of the peak reflects the number of different velocities present.

In the second situation, the gate is closer to the tube wall. The Doppler peak widens, indicating a larger range of velocities in the sampling volume. Small influences from wall movements also appear. Because the data is high-pass filtered, the spectrum amplitude at the origin remains zero.

Power spectrum of Doppler echoes near tube wall
Example: Gate near tube wall showing broader Doppler spectrum.
Power spectrum of Doppler echoes near rotating cylinder wall
Example: Gate near wall of rotating cylinder, showing multiple velocity components.

The third situation considers a rotating cylinder filled with liquid. The ultrasonic beam crosses the cylinder perpendicularly. The sampling volume near the wall reveals strong influence from wall movement. Multiple reflections can coincide with the sampling time, causing the computed mean Doppler frequency to result from both particle motion and wall motion. Displaying the power spectrum clarifies these contributions.